VitalGraph
Measured, not guessed
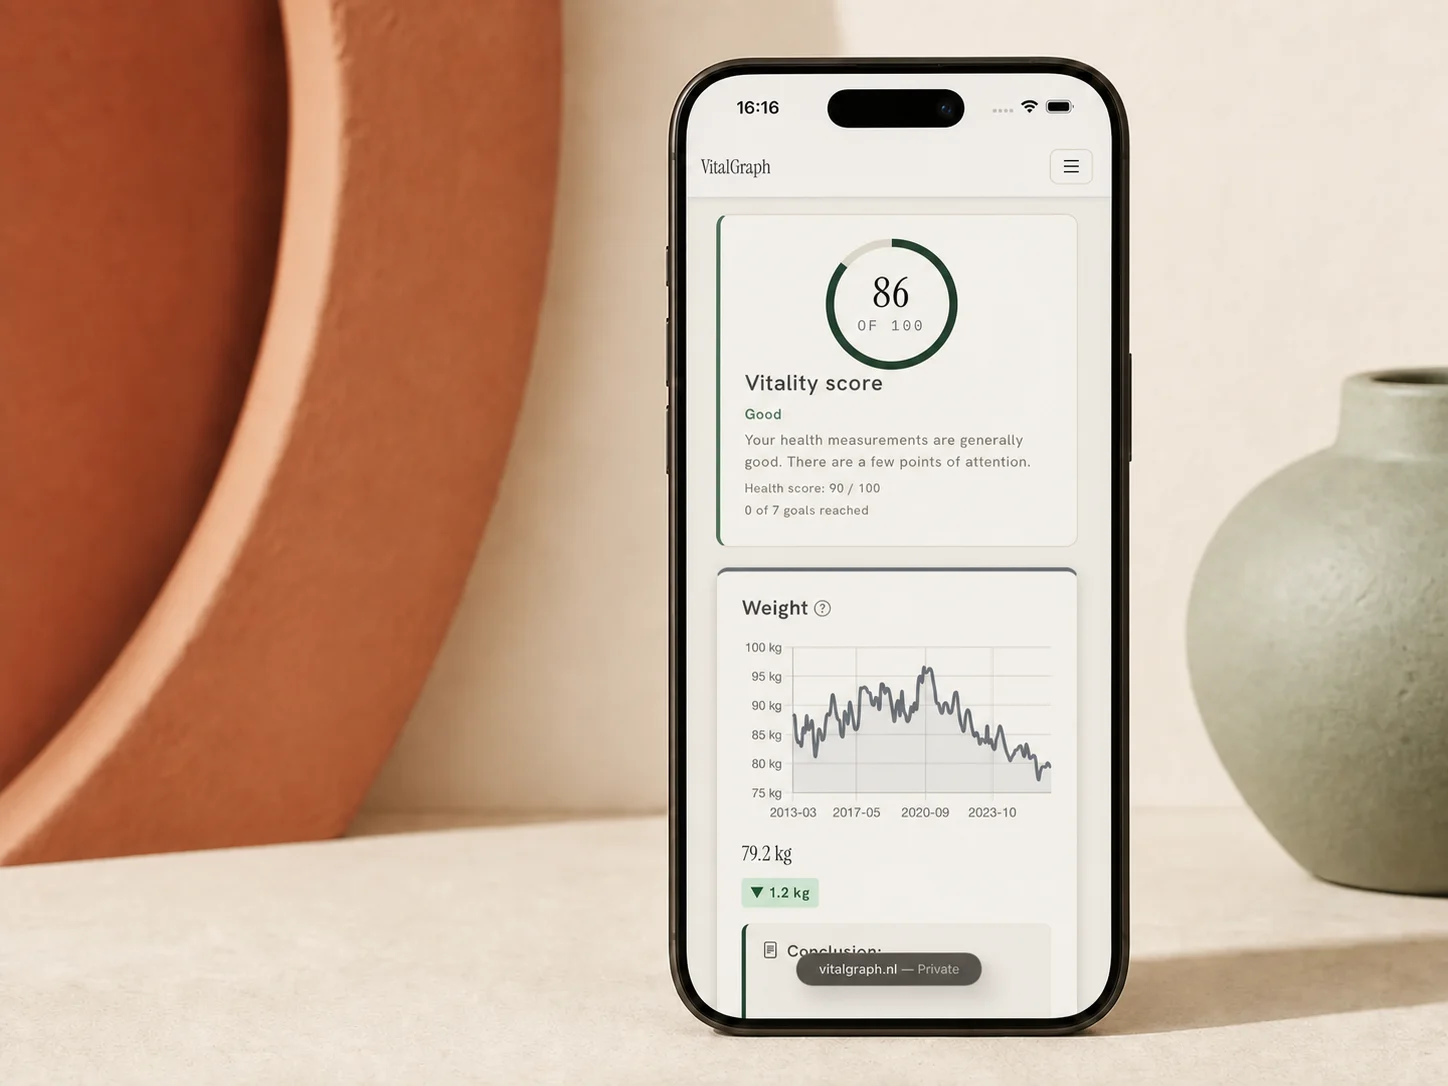
VitalGraph turns a two-minute weekly check-in into an honest picture of your health. Step on the scale, take your pulse, log it, and see six months of trend on a single line. No confetti when it rises, no sirens when it dips.
Available on Web
Measure
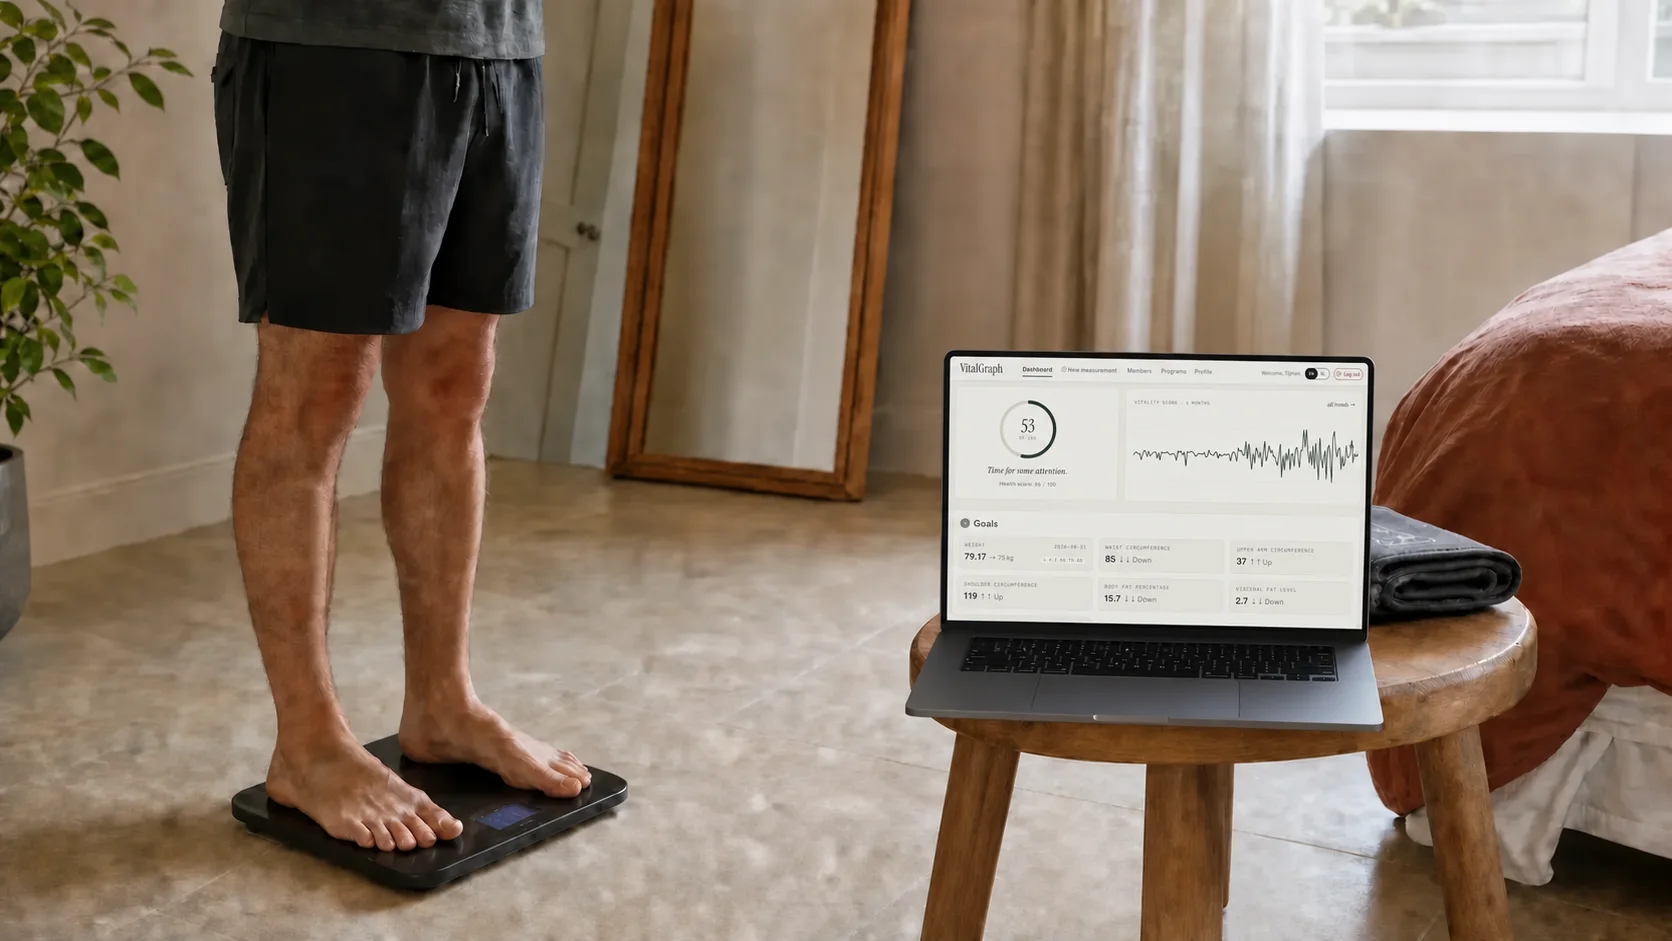
Step on the scale, take your pulse and log it in seconds. Units are up to you: kg, lb or stone.
Understand
Derived values like BMI and FFMI are calculated for you and drawn on a six-month trend line.
Adjust
A vitality score from 1 to 100, with plain-language notes on what deserves attention.
The full set of vitals
Weight, BMI, body fat, heart rate, FFMI and blood pressure, all to one decimal place.
Anyone who wants a straight, honest read on their own health, and the coaches following along with them.
Want to see what VitalGraph can do with your own numbers?
Talk to us